
Fundamental analysis is an important tool for stock investment. Unlike technical analysis, which mainly focuses on price movement by studying charts, fundamental analysis looks at economic factors such as a company’s market share, growth, revenues, earnings, profit margins, return on equity etc. to determine whether a stock worth your money.
There are many tools for doing fundamental analysis online. Yahoo! Finance is one of the most popular ones. In this tutorial, I will give a brief interview on how to do fundamental analysis using Yahoo! Finance.
Disclaimer: I’m not a professional financial analyst or a experienced investor. The information shown in this article was mainly collected from different sources on the Internet. While I will try my best to make sure the information is correct, I can’t guarantee all of info/opinions are 100% accurate or reliable.
Search Stocks on Yahoo! Finance
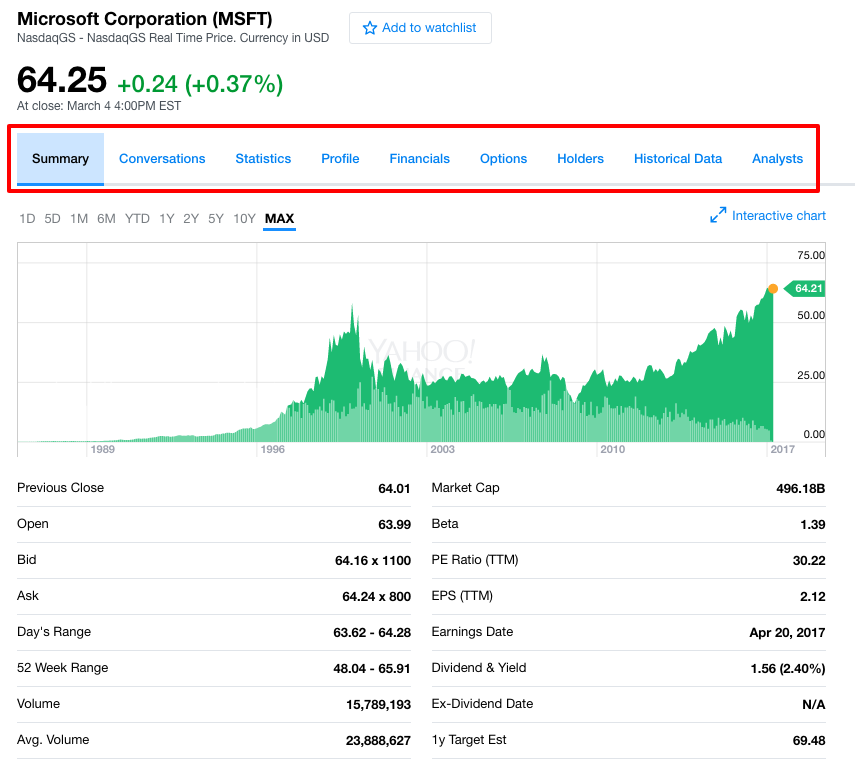
let’s use Microsoft Corporation (MSFT) as an example. First, let’s go to http://finance.yahoo.com/ and enter “MSFT” in the search box on the top and do a research. You will see a page showing information related to MSFT as below. You can see there are a few sections, including Summary, Conversations, Statistics, Profile, Financials, Options, Holders, Historical Data and Analysis:
Understanding Basic Business Information:
First let’s get some basic idea about Microsoft’s business. Click on the Profile link on top of the chart, you will see some basic information about this company such as its sector (Technology), industry (Business Software & Services), full time employees (114,000) and key executives. Scroll down a little bit, you can see a section titled Description, which is a short introduction about what this company does to make money.
If the company information on Yahoo! Finance is not enough for you, a better place to look is Microsoft’s Annual Reports or it’s Form 10-K. To find those documents, you can simply do a Google search using keywords such as “microsoft annual report [YEAR]” or “microsoft 10k [YEAR]”. You can find results from either Microsoft’s website or the SEC site. For example, you can find its Form 10-K for the fiscal year ended June 30, 2016 at this link.
When looking at Microsoft’s Form 10-K, you can focus on the Business section of Part I to get much more detailed information about its business model. Also, take a look a the section called Risk Factors to learn what could go wrong for this company.
Take a Look at Key Financial Statements:
There are three key financial statements to look at in fundamental analysis:
- Income Statement, which can tell us about a company’s profitability (Does it make money or loss money?).
- Balance Sheet, which shows a company’s staying power (Does it have enough cash? Too much debt?).
- Cash Flow, which shows the detailed in and out flow of a company’s cash (Seeing real cash coming in is more convincing than what’s claimed in the income statement).
To get a overview of these statements, you can go to the Financials section for Microsoft on Yahoo! Finance, where you can see three sub-sections titled Income Statement, Cash Flow and Balance Sheet. Also, you can study them either by year (click on the Annual link to the right) or by quarter (click on the Quarterly link to the right).
However, unless you have spent some serious time studying accounting, you might find this information overwhelming and confusing. Don’t worry, I have good news for you: we are not going to spend too much time here. I just wanted to show you where things can be found. We won’t look at these data in detailed. We have a better place to look at pretty much the same information with numbers that will make more sense to us.
That’s the most important section on Yahoo! Finance: Statistics.
Study Important Data in the Statistics Section:
The most important place on Yahoo! Finance to do our fundamental analysis is the Statistics section. A lot of numbers here were calculated from numbers in the income statement, balance sheet and cash flow. So the Statistics section covers basic information from these there statements but is much easier to look at and analyse.
When you click on the link and come to this section, you view see something like this picture below. We will spend most our time on this page and will go through the statistics in details. You can also find definitions for some of the key statistics from Yahoo!’s Help Page.
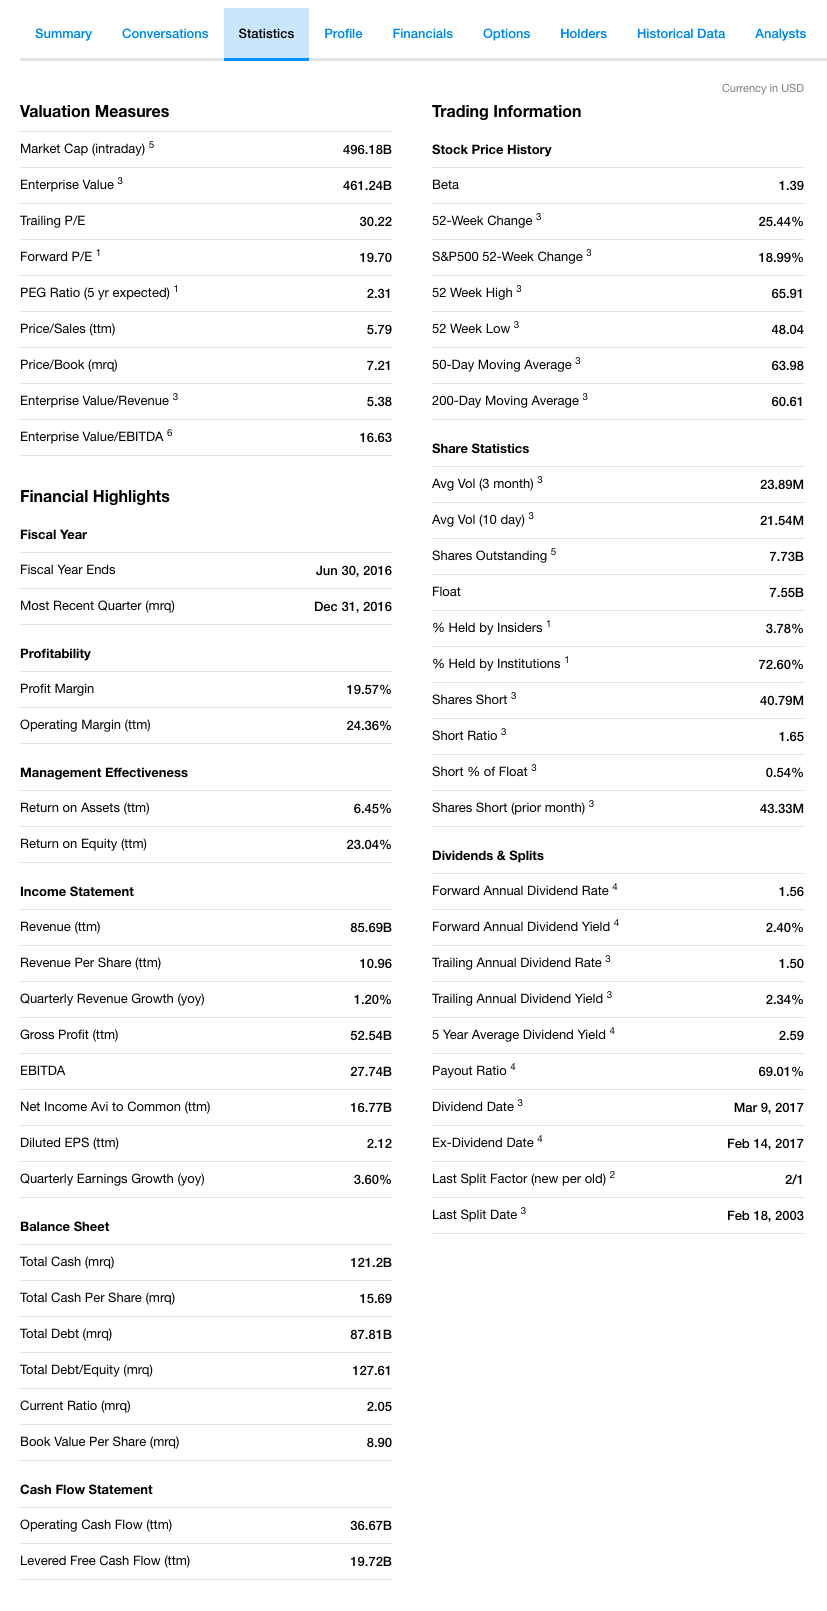
Now let’s go over each subsections on the Statistics page and understand what these numbers are and how to use them.
Valuation Measures:
This sub-section is one of the most important parts to look at. Basically, the numbers you see here can help us decide on how much this stock “really” worth based on how well the company does it business.
Let’s look at each of them.
Market Cap (intraday):
Market cap, or market capitalization, measures the total value of a company by looking at the total market value of all of its outstanding shares. It’s calculated by multiplying the current market price of its stock by the number of shares outstanding. For MSFT, its current stock price is $64.19 and its shares outstanding is 7.73 Billion. Therefore, its market cap is 64.18 x 7.73 = 496.18B.
Enterprise Value:
Enterprise Value (EV) is another way to measure a company’s total value. This number can be understood as the money a buyer needs to pay if this company is for sale. How much does the new owner have to pay in an acquisition? The buyer not only needs to pay the equity value (roughly the value of market cap), but also needs to repay the company’s debts (and keeps its cash if there is any). Therefore, Enterprise Value is roughly calculated by adding total debt to the company’s market cap and then subtracting cash and investments. For Microsoft, this number is 461.24B.
EV is believed to be a better indicator than market cap because it also takes a company’s capital structure into consideration. When looking at EVs, people often look at ratios such as EV/Revenue and EV/EBITDA, which we will cover soon.
Trailing P/E:
P/E stands for price-earning ratio. It’s probably the most popular valuation metric and it basically tells us how much investors are willing to pay for a claim to one dollar of a company’s earnings.
P/E ratio is calculated as: Market Value per Share / Earnings per Share.
When you calculate P/E, for the number of earnings, you can either use the net earnings over the last 12 months, which gives you the Trailing P/E, or use the estimated net earnings over next 12 months, which gives you the Forward P/E.
When you compare P/E ratios between two companies in the same industry (cross-industry comparison is not very useful), roughly speaking, you can say the one with a lower P/E might be underpriced and thus more attractive, and the one with a higher P/E might be overvalued and thus less attractive.
Theoretically, the P/E ratio could be negative, if the earnings is a negative number (representing a loss). A negative P/E ratio is really a bad sign. However, negative P/E could be reported as “N/A”.
The average trailing P/E ratio of S&P 500 stocks is 25.54 as of Jan 2017, 22.18 as of Jan 2016 and 20.02 as of Jan 2015. (source)
Forward P/E:
As mentioned above, Forward P/E is calculated as: Market Value per Share / Estimated Earning (over next 12 months) per Share.
Note that while Trailing P/E is calculated using real historical data, Forward P/E is calculated using estimated earning data provided by financial analysts. As analyst’s estimates tend to be over-optimistic, forward P/E number might not be that reliable.
Roughly speaking, when you compare a company’s trailing P/E to its forward P/E, it’s a good sign that the forward P/E is lower than the trailing P/E, because that indicates this company’s earning is likely increase next year.
PEG Ratio:
When you compare two company’s P/E ratios, you can’t simply conclude that the one with the lower P/E is the cheaper one and thus a better deal. That’s because if the expensive one has a much higher growth rate, it might eventually turn out to be a better deal. Unfortunately P/E doesn’t consider a company’s growth rate. However, the PEG ratio does.
The PEG ratio stands for price/earning to growth ratio. It’s calculated by a stocks’s P/E ratio divided by the growth rate of its earnings for a period of time (5 years expected earnings in Yahoo! Finance in this example).
When you compare two companies in the same industry using PEG ratio, simply put, the one with a lower value looks more attractive.
Please note that the five-year growth rate used in Yahoo! Finance’s PEG ratio calculation was estimated by financial analysts, so you should take the PEG value with a handful of salt, just like with Forward P/E. Also, many investors believe while PEG is quite accurate for growth companies, it gives inaccurate results for dividend stocks.
What is considered a good PEG ratio? Well, some investor believes that positive PEG ratios lower than 1 are attractive (suggesting that stock is undervalued) and a PEG ratio of 2 or more indicates a stock is overvalued.
Theoretically the PEG ratio could be negative. There are two possibilities: 1) The company reported a loss, so the P/E ratio is negative. This is a really bad sign. 2) The company has positive earnings, but the future earnings are going to decline. This is not a good sign but it’s not as bad as the first case.
Price/Sales (ttm):
The price-sales ratio (P/S ratio) compares a company’s stock price to its revenue. It’s similar to the P/E ratio but measures the stock price against sales (revenue), instead of earnings. P/S ratio is calculated as: Stock Price per Share / Net Sales (Revenue) per Share. Note, “ttm” stands for “Trailing Twelve Months”.
Many investors trust the P/S (Price/Sales) ratio more than the P/E (Price/Earning) ratio because unlike the earning number, the sales (revenue) number is less likely to be manipulated using accounting estimates and management manipulations.
Generally speaking, when comparing two companies in the same industry, the one with a lower P/S ratio looks more attractive.
Price/Book (mrq):
The price-book ratio (P/B ratio) compares a company’s stock price to its book value, which is the value of a company according to its “books” (financial statements) and is the difference between a company’s total assets and its total liabilities. Note, “mrq” stands for “Most Recent Quarter”.
P/B ratio is calculated as: Stock Price / (Total Assets – Intangible Assets & Liabilities).
A lower P/B ratio might suggest this stock is undervalued.
Due to accounting conventions, P/B ratio is typically above 1. When looking at companies with negative earnings, the P/E ratio become useless. In this case, the P/B ratio might be useful. P/B ratios can be less useful for service and IT companies with little tangible assets.
Enterprise Value/Revenue:
The enterprise-value-to-revenue (EV/R) ratio compares a company’s enterprise value to its revenue. We have talked about enterprise value earlier. EV/R is calculated as: Enterprise Value / Revenue.
When comparing two companies in the same industry, a lower EV/R means this company could be undervalued and a high EV/R means the company could be overvalued.
Enterprise Value/EBITDA:
EBITDA (earnings before interest, tax, depreciation and amortization) is a way to measure a company’s performance. It’s essentially a company’s net income with interest, taxes, depression and amortization added back in order to eliminate the effects of financing and accounting decisions so that the profitability of different companies can be compared more meaningfully.
Enterprise Value/EBITDA (EV/EBITDA) compares a company’s enterprise value to its EBITDA. EV/EBITDA is calculated as: Enterprise Value /EBITDA.
EV/EBITDA is the most widely used stock valuation measure based on enterprise value and it’s often used as an alternative to, or in conjunction with the P/E ratio. The advantage of using EV/EBITDA is that it’s capital structure-neutural when comparing different companies.
Some analysts recommend using EV/EBITDA as the primary stock valuation measure instead of P/E.
When comparing two companies in the same industry, a lower EV/EBITDA means this company could be undervalued and a highEV/EBITDA means this company could be overvalued.
According to Investopedia, Many analysts and investors believe a EV/EBITDA below 10 is a healthy sign for a company. The average EV/EBITDA value for the overall market is 14.7
OK. So far we have finished the Valuation Measures section for the Statistics part. Let’s move on to look at the rest.
Financial Highlights
Fiscal Year:
A fiscal year is an accounting period of one year that does not necessarily begin with Jan 1 and ends on Dec 31. In this section on Yahoo! Finance, you can find out when a fiscal year ends for a company as well as what the post recent quarter is for this company. For example, for Microsoft, the fiscal year ends on Jun 30. Knowing when a fiscal year ends can help us know when to expect to see a company’s annual reports.
Profitability:
In this section you can find metrics to assess how good the company is at making money.
Profit Margin: This number is a measure of a company’s financial performance. It’s calculated as: Net Income / Net Sales (Revenue). Microsoft’s current profit margin is 19.57%, which means this company has a net income of $0.19 for each dollar of total revenue earned. Different industry has different average profit margins. When you compare two companies within the same industry, the one with a higher profit margin looks more attractive.
Operating Margin (ttm): This number measures a company’s pricing strategy and operating efficiency. It’s calculated as: Operating Income / Net Sales (Revenue), in which “operating income” is the profit to keep after removing operating expenses (for example, wages and cost of goods sold). When you compare two companies within the same industry, the one with a higher operating margin looks more attractive.
Management Effectiveness:
This section shows metrics measuring how good the management team is at achieving business objectives.
Return on Assets (ttm) : shows how profitable a company is relative to its total assets and indicates how efficient management is at using its assets to generate earnings. It’s calculated as: Net Income / Total Assets. When you compare two similar companies, the one with a higher ROA looks more attractive.
Return on Equity (ttm) : shows how profitable a company is relative to shareholder’s equity. It’s calculated as: Net Income / Shareholder’s Equity. When two similar companies are compared, the one with a higher ROE looks more attractive.
Income Statement:
This section lists the most important data from a company’s income statement, which can tell us about a company’s profitability (Does it make money or loss money?).
Revenue (ttm): the company’s gross income, or the total amount of money the company has received during the last 12 months. The higher the better.
Revenue Per Share (ttm): the ratio that compares a company’s total revenue over its shares outstanding. Revenue Per Share (ttm) is calculated as: Total Revenue of the Last 12 Months / Common Shares Outstanding from the Most Recent Quarter. The higher the better.
Quarterly Revenue Growth (yoy): the increase of the company’s revenue when compared to the same quarter last year. Note, “yoy” stands for “Year Over Year”. This number measures a company’s growth. A high positive number is a good sign.
Gross Profit (ttm): the company’s total revenue of the last 12 months minus the cost of goods sold. It’s calculated as: revenue – costs of goods sold. It assesses the company’s efficiency at using supplies and labor. It considers variable costs (costs that changes according to the level of output) but doesn’t consider fixed costs (those doesn’t change, such as insurance, rent, office supplies, salaries for employees not directly involved production). The higher, the better.
EBITDA: As mentioned earlier, EBITDA (earnings before interest, tax, depreciation and amortization) is essentially a company’s net income with interest, taxes, depression and amortization added back in order to eliminate the effects of financing and accounting decisions so that the profitability of different companies can be compared more meaningfully. The higher, the better.
Net Income Avi to Common (ttm): Net Income Available to Common Shareholders, which measures common shareholder’s claim on the company’s cash flow. It’s calculated as: Net Income – Preferred dividends. This number is used for calculating earnings per share (EPS).
Earnings Per Share (EPS) = (Net Income – Preferred dividends) / Outstanding Shares.
Diluted EPS (ttm): Diluated Earnings Per Share, which is a more conservative measure of earnings per share, because it’s the EPS if all convertible securities were exercised. Diluted ESP is usually lower than EPS.
Quarterly Earnings Growth (yoy): the increase of the company’s earnings when compared to a the same quarter last year. This number measures a company’s growth. A high positive number is a good sign.
Balance Sheet:
This section lists the most important data from a company’s balance sheet, which shows a company’s staying power (Does it have enough cash? Too much debt?).
Total Cash (mrq): the company’s total amount of cash in the most recent quarter. Cash is the money that this company has on hand that is not coming from borrowing or financing.
Total Cash Per Share (mrq): the company’s total cash in the most recent quarter divided by its shares outstanding. A higher cash per share number means this company has more cash at hand, which could mean this company has a better chance to survive a bad economic climate, but could also mean this company is unwilling to invest.
Total Debt (mrq): the company’s total amount of debt in the most recent quarter. Debt is the money the company has borrowed. Different industry uses differently level of debt, or leverage (using borrow money to increase value).
Total Debt/Equity (mrq): this is the ratio of the company’s total debt in the most recent quarter over its shareholder’s equity. Note this number in Yahoo! Finance is actually a percentage number. In other words, if you see 127.61, it’s actually 127.61%, or 1.2761. Debt/Equity measures a company’s financial leverage (how much this company uses debt to pay for operations). A high number generally suggests this company is pretty aggressive in using debt to finance its growth. Some investors believe a high debt/equity ratio (above 2.0, or 200%, or 200 as shown in Yahoo! Finance) suggests too much leverage and is worrisome.
Current Ratio (mrq): a comparison of the current assets to current liabilities in the most recent quarter. It’s calculated as: Current Assets / Current Liabilities. This ratio measures a company’s ability to pay short-term and long-term obligations. A current ratio greater than 1 means this company’s current assets is greater than its current liabilities and thus would not run into problems in paying off its obligations if they came due. On the other hand, if this ratio is under 1, this company might run into problems. A current ratio below 1 is usually a bad sign. However, a very high current ratio (over 3) might suggest this company is not using its current assets efficiently.
Book Value Per Share (mrq): as mentioned earlier, book value is the value of a company according to its “books” (financial statements) and the difference between a company’s total assets and total liabilities, and is also referred to as shareholder’s equity. Book value per share is calculated as: (Shareholder’s Equity – Preferred Stock) / Average Outstanding Common Stock. Book Value Per Share can be understood as the amount of money a share holder would get if the company were to liquidate. If the book value per share is higher than the market value per share, then this stock might be undervalued.
Cash Flow Statement:
This section lists the most important data from a company’s cash flow statement, which shows the detailed in and out flow of this company’s cash (Seeing real cash coming in is more convincing than what’s claimed in income statement).
Operating Cash Flow (ttm): this is the amount of cash generated by the company’s business operations. Why do we need to look at this number? That’s because looking at revenue alone might not be sufficient as even if sales are good, the company might have problem collecting the cash. Remember, a high earning number might be smoke and mirrors made possible from accounting rules, but a good operating cash flow number is more convincing.
Levered Free Cash Flow (ttm): the amount of cash the company has left after paying all its financial obligations. This number measures how much cash this company has to expand its business and to pay dividends to shareholders. Generally speaking, a positive levered free cash flow is a good sign, especially in tough times. However, a negative free cash flow (especially temporary) could mean this company has made large capital investments.
Most Important Metrics for Fundamental Analysis:
So far we have covered a lot metrics provided by Yahoo! Finance. Given there’re so many numbers to look at, you might feel overwhelmed. Now, let’s take a look at the most important ones among them:
1. Trailing P/E:
The price-to-earning ratio indicates how much investors are paying for each dollar of the company’s earnings. You can compare the P/E ratio between companies in the same industry (Note: comparing P/E ratios across different industries is not a good idea) to determine which stocks are undervalued and which ones are overvalued. With all other things being equal, the one with a lower P/E ratio is more attractive.
2. Price/Book:
The price-to-book ratio (P/B ratio) indicates how much investors are paying for each dollar of the company’s tangible assets. When you compare P/B ratios between similar companies, with all other things being equal, the one with a lower P/B ratio is more attractive. Note that for companies with significant intangible assets (service and IT companies), P/B ratio might not be that useful.
3. Total Debt/Equity:
The debt/equity ratio measures this company’s financial leverage (how much the company uses debt to pay for operations). Different industry has different average debt/equity numbers. A very high number suggests high risk in meeting financial obligations. Generally speaking, the debt/equity ratio should not be above 2 (or 200 as shown in Yahoo! Finance).
4. Levered Free Cash Flow:
This number tell us how much cash the company has left after paying all its financial obligations. Generally speaking, a positive levered free cash flow is a good sign, especially in tough times. However, a negative free cash flow (especially temporary) could mean that the company has made large capital investments.
5. PEG Ratio:
The price/earning to growth ratio adds growth rate to the P/E ratio. Therefore, when deciding whether a stock is undervalued or overvalued, you can use the PEG ratio to take earnings growth into account. When you compare two companies in the same industry using the PEG ratio, with all other things being equal, the one with a lower value looks more attractive. However, please note that the five-year growth rate used in Yahoo! Finance’s PEG ratio calculation was estimated by financial analysts, therefore, you should take the PEG value with a handful of salt.
Conclusion:
We have finished going over some of the most important data on Yahoo! Finance for fundamental analysis. I’d like to point out that fundamental analysis is much more complicated than what has been covered here. One should also spend time understanding the business details of the company, studying its industry, monitoring the economy and use other resources such as the COT report. But I hope this article can help you at least understand how to look at Yahoo! Finance when doing fundamental analysis on a stock.